Metric Monitors
Metrics monitors are the foundation of data observability in Soda. Soda automatically collects dataset level metrics and tracks how those evolve over time.
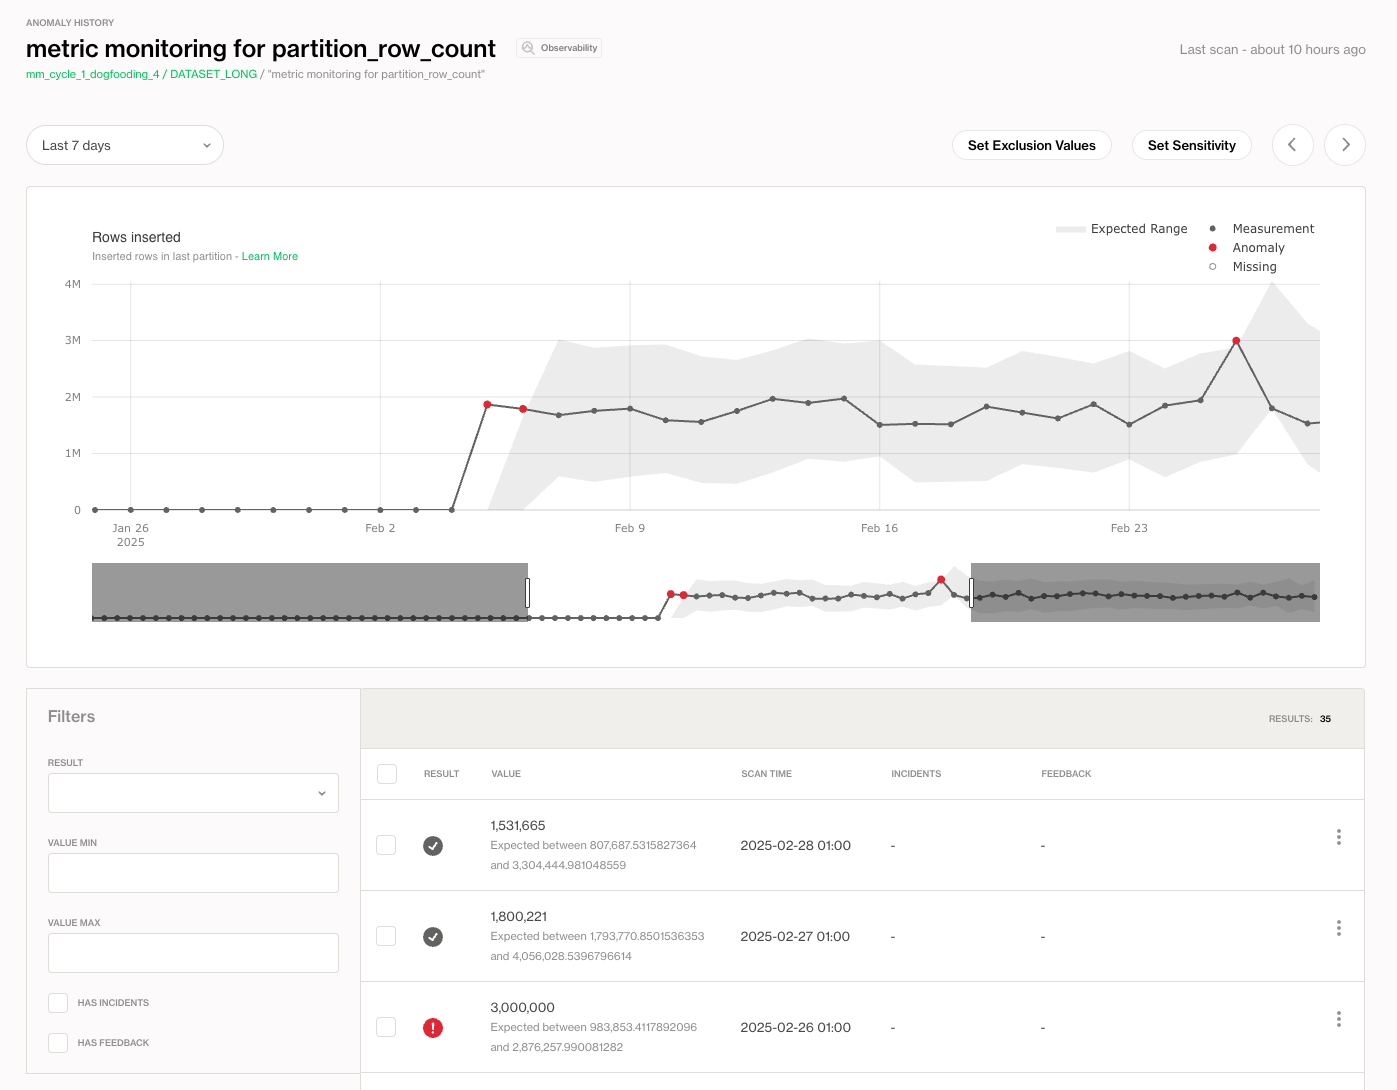
Soda then uses a proprietary anomaly detection algorithm to identify when metrics deviate from expected patterns. These deviations are surfaced in the Metric Monitors tab for each dataset.
You can use metric monitoring to:
- Spot problems without writing checks
- Establish baselines for normal behavior
- Use opt-in alerts to notify data owners when something unusual happens
- Provide insight to business users without requiring code
Key capabilities
-
Built for scale: Soda collects dataset-level metrics efficiently by accessing database metadata and leveraging metadata history when available. It calculates all metrics using optimized methods to reduce the computational load on your database and deliver fast results.
-
Get instant insights: Soda supports native backfilling and backtesting. You can calculate historical data quality metrics and apply anomaly detection algorithms retroactively. This builds a more complete picture of past data quality and helps surface new issues.
-
Reduce false alerts: Soda’s proprietary algorithm is 70% more accurate at detecting anomalies in data quality metrics than external frameworks such as Facebook Prophet.
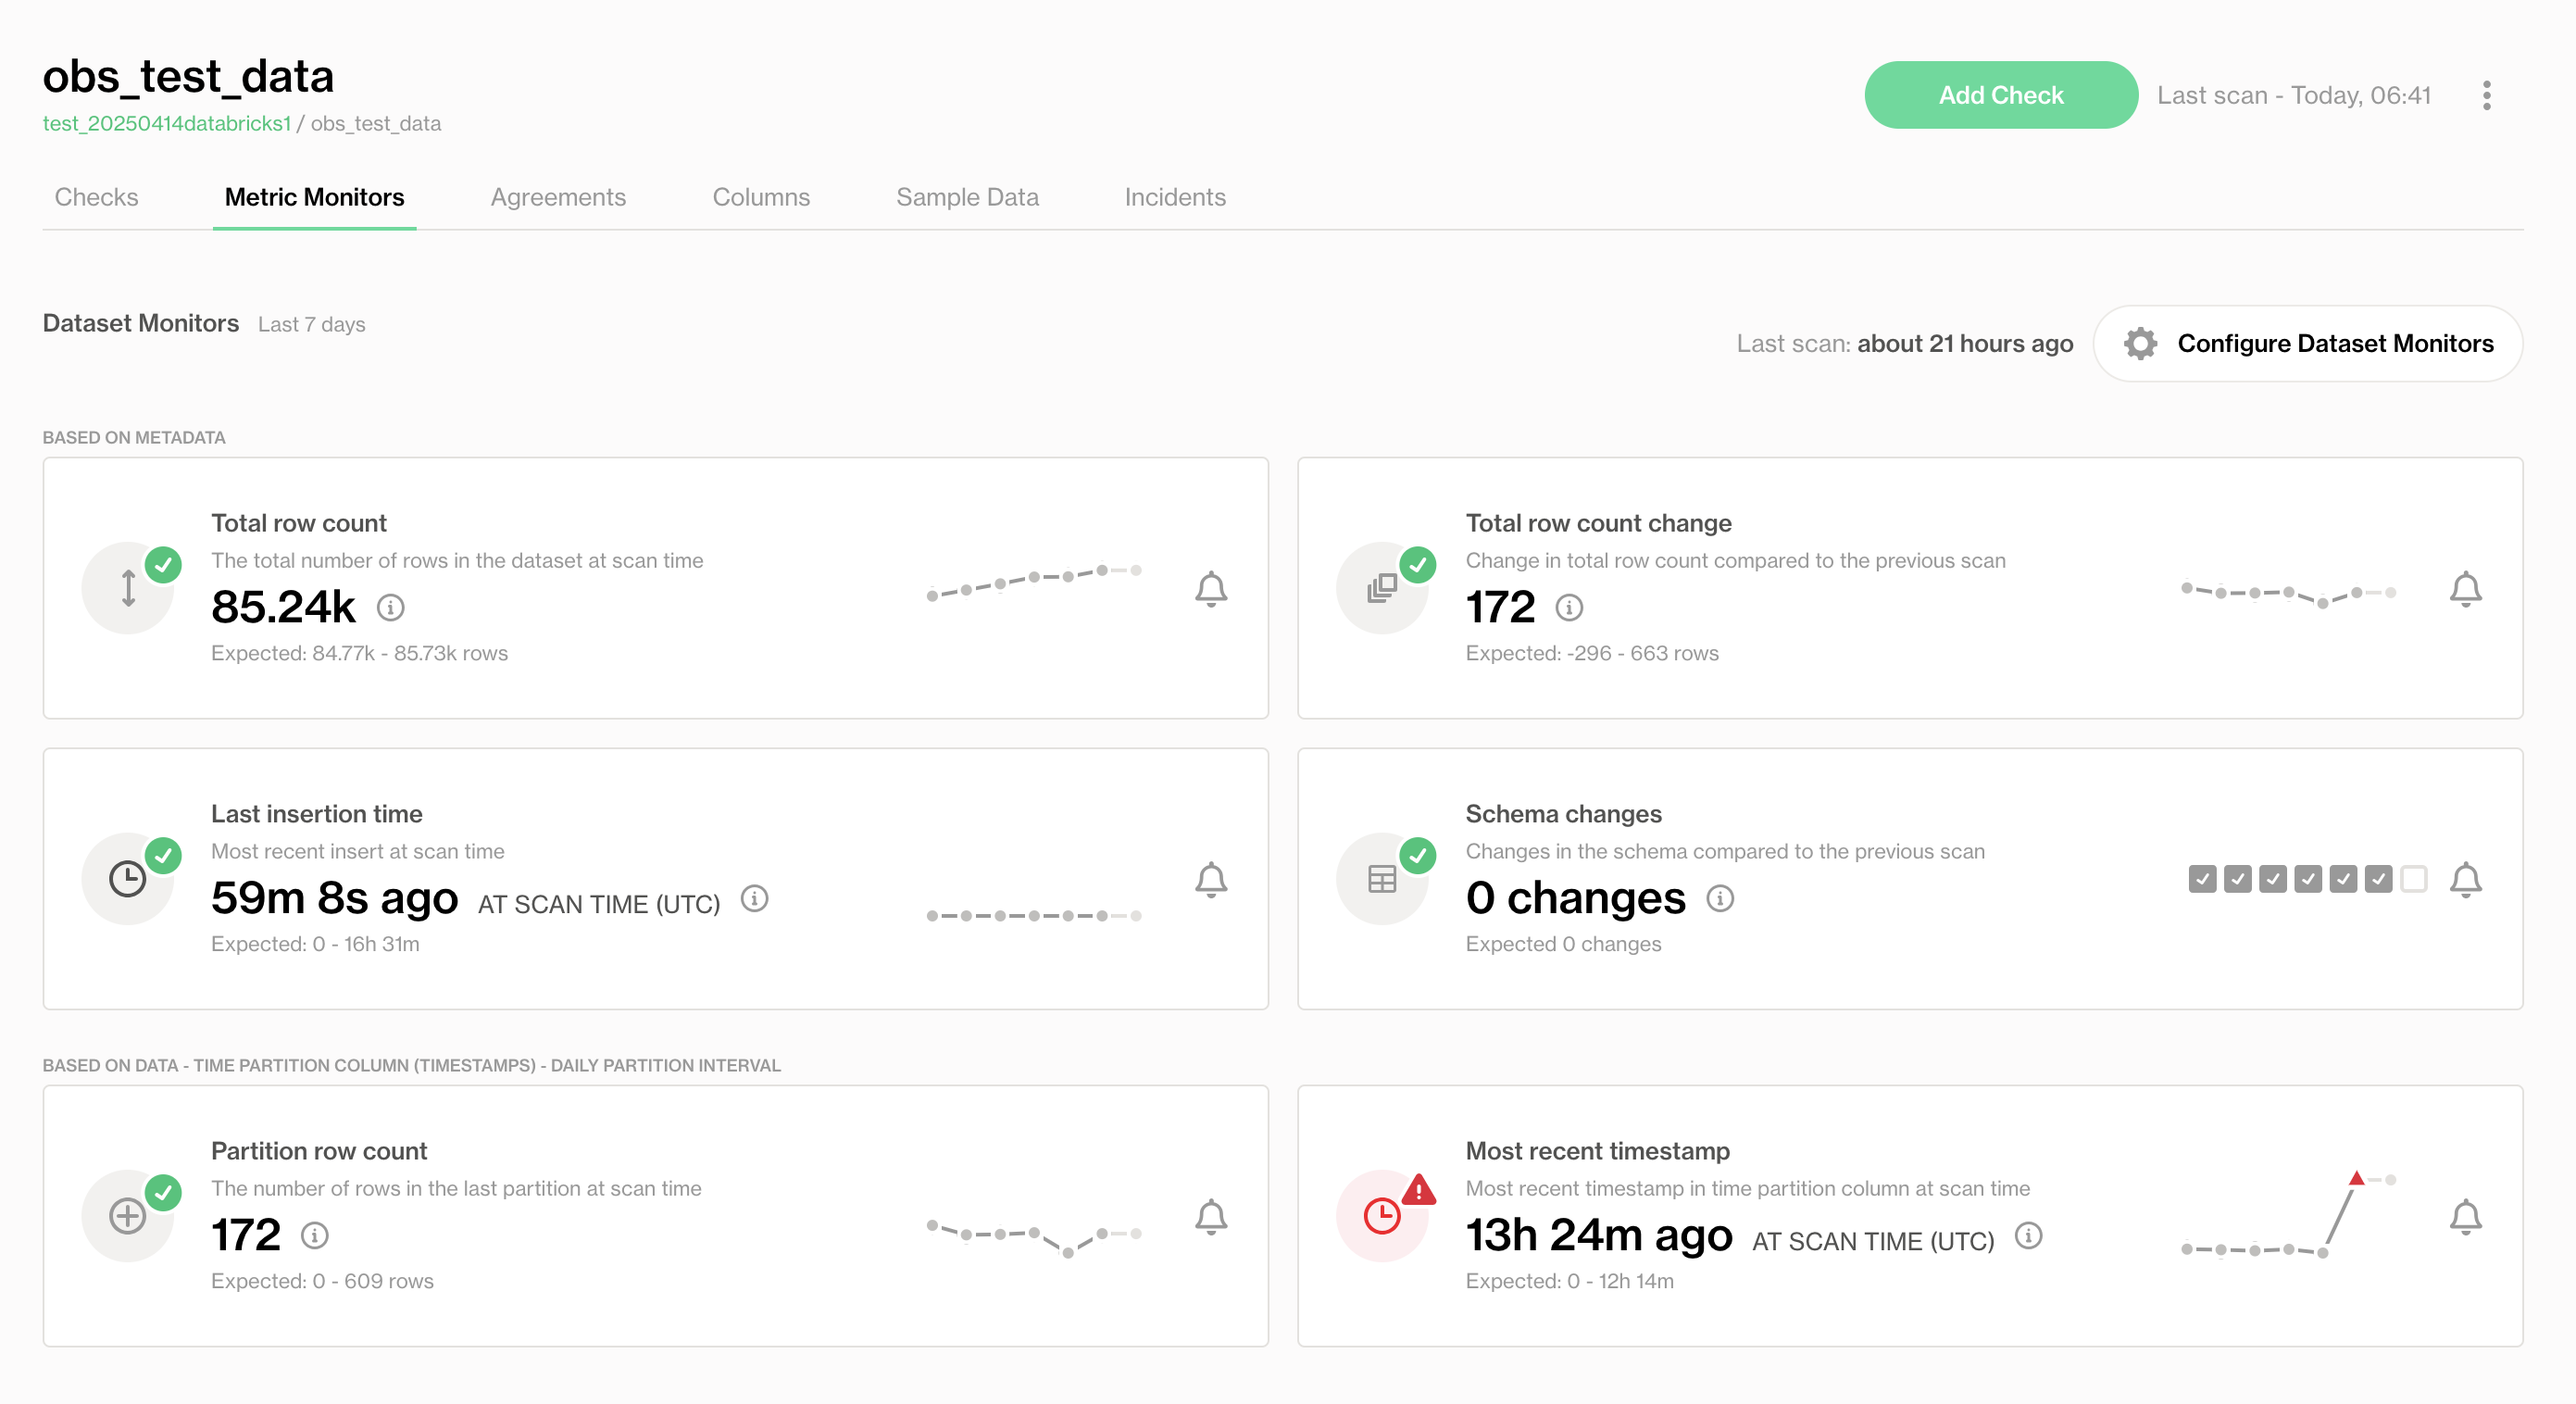
Below is a table of the Metric Monitors that Soda supports:
| Metric name | Based on | How it’s calculated |
|---|---|---|
| Total Row Count | metadata | The total number of rows in the dataset at scan time obtained from metadata. |
| Total Row Count Change | metadata | The total number of rows at the previous scan time deducted from the current total row count obtained from metadata at scan time. |
| Last Insertion Time | metadata | The time of last insert at the scan time obtained from metadata and deducted from the scan time. |
| Schema Changes | metadata | The number of changes in the dataset schema at the scan time compared to the previous scan. |
| Partition Row Count | data | The number of rows inserted in the last partition. |
| Most Recent Timestamp | data | The most recent timestamp in the time partition column at scan, deducted from scan time. |
For Schema Changes, the expected result is always to have no schema changes, regardless of whether there have been frequent schema changes in the past or not.
How does partitioning and profiling work?
When you set up the anomaly dashboard, Soda begins by partitioning your data. To maximize efficiency, Soda does not profile the entire dataset; instead, it partitions your data to profile only a representative sample.
Profiling involves extracting metrics such as the mean, minimum, and maximum values in a column, and counting the number of missing values.
Here’s how Soda partitions your data for profiling:
-
With a
TIMEtype column: Soda identifies a column containingTIMEtype data and partitions the dataset to include only the last 30 days of data. -
Without a
TIMEtype column:- If the dataset contains fewer than one million rows, Soda profiles the entire dataset.
- If the dataset contains more than one million rows, Soda randomly selects a sample of one million rows for profiling.
What makes Soda’s Anomaly Detection the most accurate and fastest?
-
All components of the system have been developed from the ground up and ensembled internally, without relying on third-party frameworks such as Facebook Prophet, which tend to impose rigid modeling assumptions and lack interpretability.
-
A key differentiator of our algorithm is the full transparency and control we have over the modeling stack. This enables us to rigorously evaluate, explain, and improve model behavior—crucial for high-stakes use cases like data quality monitoring.
-
The algorithm has been benchmarked against Prophet and demonstrated a 70% improvement in detecting anomalous data quality metrics. This performance gain is essential in production environments where false positives and missed anomalies can significantly erode trust and create operational inefficiencies.
-
The algorithm begins by characterizing the time series based on complexity and the presence of seasonality. A routing mechanism then dynamically selects the optimal modeling path. One of the core modeling strategies involves adaptive exponential smoothing, which allows for robust trend and seasonality capture.
-
The model supports both automatic learning of new patterns and user-in-the-loop feedback for continuous refinement.
What’s Next?
- Explore how to adjust the sensitivity of the algorithm
- Explore how to define exclusion value rules
- Explore how to give feedback to the model to improve detection